-

Fototrend
Ez egy agyalós-beszélgetős Covid-19 topik. Érvelni kötelező, a másikkal foglalkozni tilos, rettegőzés duplán, a szemlélet tudományos (a "meddig maradjanak a lezárások", azaz a társadalmi rész elfér, de csak szűken/járványhoz kapcsolódóan), ergo nem oltásellenes, nem hit alapú. Ami ebben a szellemben íródik, marad, ami nem, az nem, téríteni meg se próbálj.

Új hozzászólás Aktív témák
-

Ringman
nagyúr
jó, hát mindent nem lehet

azt nem mondtam hogy *értelmes* ábrát keresett a fórumtárs.szerk:
a substackes cikkben szereplő paper írja le amúgy (a bemásolt kép az ennek az adaptációja)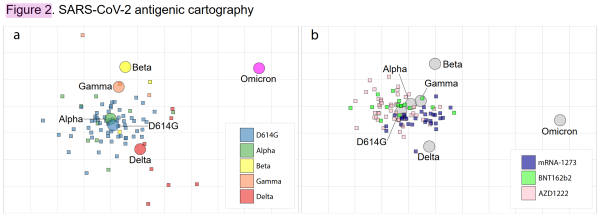
Figure 2. SARS -CoV-2 antigenic cartography. a. Antigenic map of SARS-CoV-2 VOCs
based on post-SARS-CoV-2 infection sera. SARS-CoV-2 VOCs are shown as circles and sera
are indicated as squares. Each square corresponds to sera of one individual and is coloured
by the infecting SARS-CoV-2 variant. Both axes of the map are antigenic distance and each
grid square (1 antigenic unit) represents a two-fold change in neutralization titre. The distance
between points in the map can be interpreted as a measure of antigenic similarity of similarity
in reactivity where closer together points are more similar. b. Antigenic map of SARS-CoV-2
VOCs based on post-vaccination sera from individuals without prior SARS-CoV-2 infections.
Each serum is coloured by the vaccine that individual received.[ Szerkesztve ]


Új hozzászólás Aktív témák
Állásajánlatok
Cég: Promenade Publishing House Kft.
Város: Budapest

Cég: Ozeki Kft.
Város: Debrecen